
A new site is live: weatherguard.space. Severe storms on Earth, aurora from the Sun, and archived weather on other worlds — tracked through interactive demos, not data tables.
Spaceship Adventures has always been about putting you in a cockpit that feels real. WeatherGuard is a sibling product from the same desk: a mission-control weather brand that treats the Sun, Earth, and other worlds as one system. It is not a city forecast site. It is a dashboard you can scrub, map, and (on the space page) drop into WebXR.
Three rooms, one brand
The site is three sections. Each one is a live demo, not a marketing page.
- Space Weather — the flagship. Live Kp, GOES X-ray class, and the OVATION equatorward aurora line from NOAA SWPC, plus a 3D / WebXR globe and a historical solar-storm replay.
- Earth Severe Weather — active Extreme and Severe NWS products on a map and a globe. Polygons color-coded by hazard. Not your local hourly forecast.
- Planetary Weather — an InSight Mars archive. Temperature, wind, and pressure at Elysium Planitia, sol by sol, after the lander retired in 2022.
Space: live Kp, then scrub a superstorm
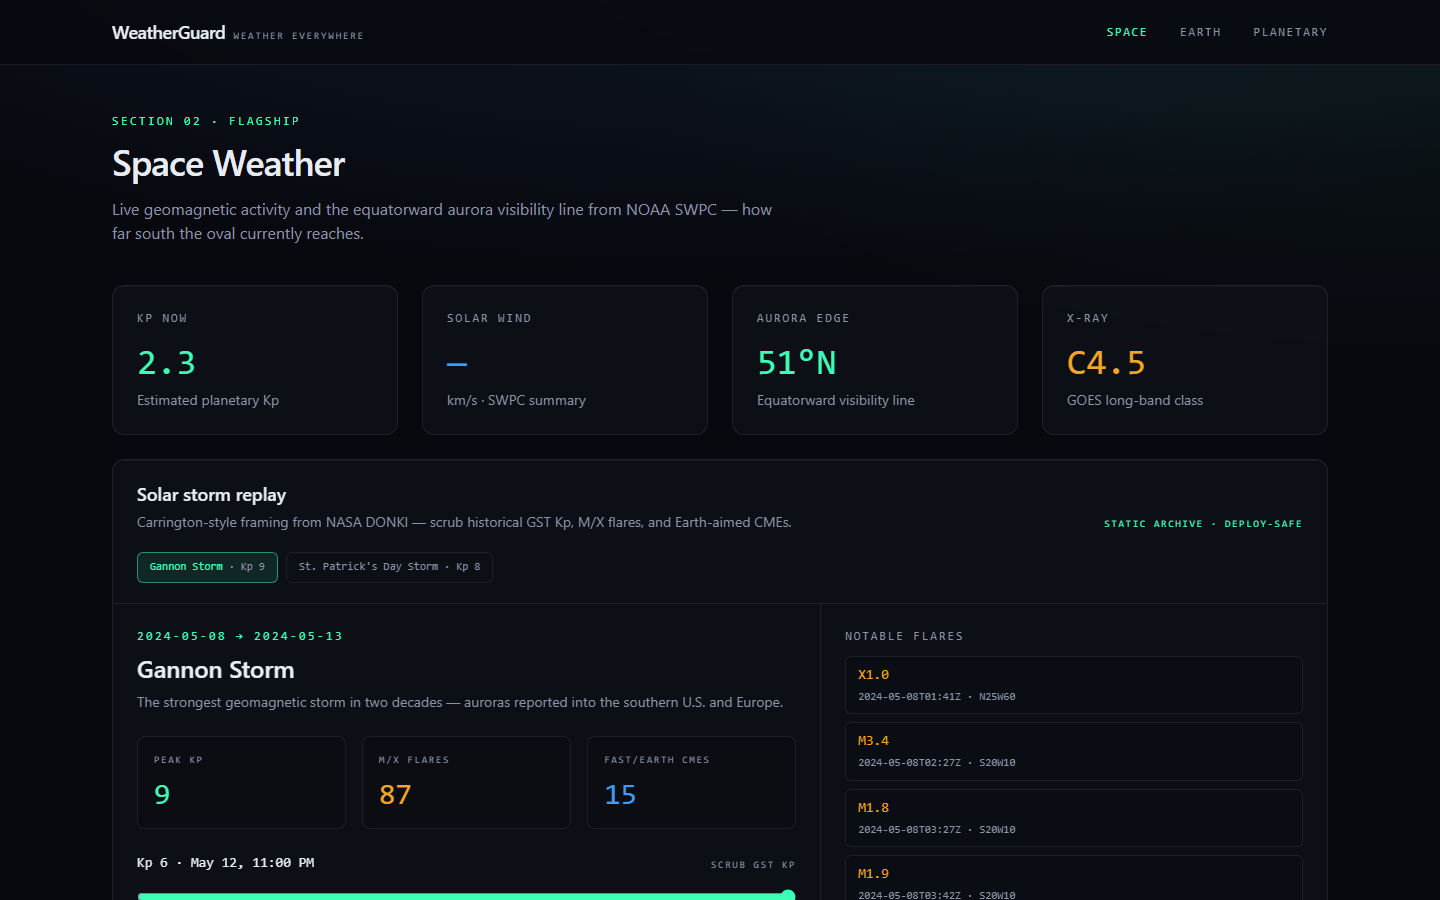
The space page opens with the numbers that matter right now: planetary Kp, solar wind, how far south the aurora oval currently reaches, and the GOES long-band X-ray class. Feeds cache for about five minutes so the dashboard stays snappy.
Below that is the differentiator we have been chasing in the SSA data-playback notes for years: replay. Named storm windows from NASA DONKI are frozen as JSON so you can scrub GST Kp, M/X flares, and Earth-aimed CMEs without a live NASA key on every deploy. Two storms ship with the first release:
- Gannon Storm (May 2024) — peak Kp 9, the strongest geomagnetic storm in two decades, auroras into the southern U.S. and Europe.
- St. Patrick's Day Storm (2015) — a classic CME-driven G4 event from solar cycle 24, peak Kp 8.
Further down the page: an OVATION aurora map, then a rotating Earth with the live equatorward oval. Enter VR if the browser supports WebXR — stand above a storm-marked globe instead of reading a table.
Earth: alerts as polygons, not a forecast widget
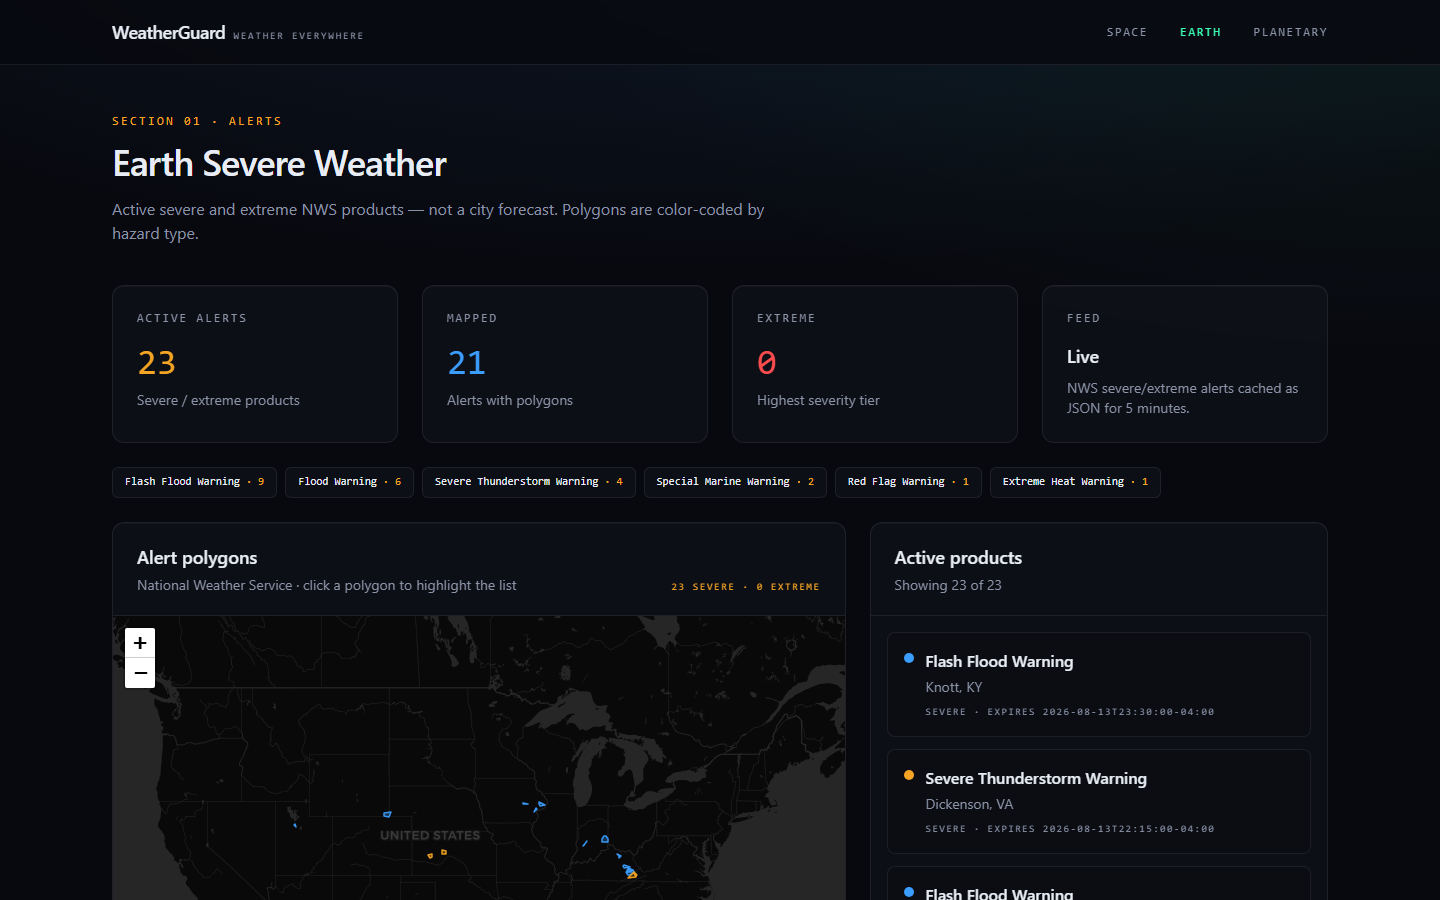
The Earth page pulls the National Weather Service API and keeps only Extreme and Severe products. Flash floods, thunderstorms, marine warnings, red flag, extreme heat — mapped as polygons and listed with expiration times. Same five-minute JSON cache as space weather. If you want “will it rain at 3pm,” this is the wrong site. If you want a wall of current hazards, this is the room.
Planetary: InSight, after the lander went quiet
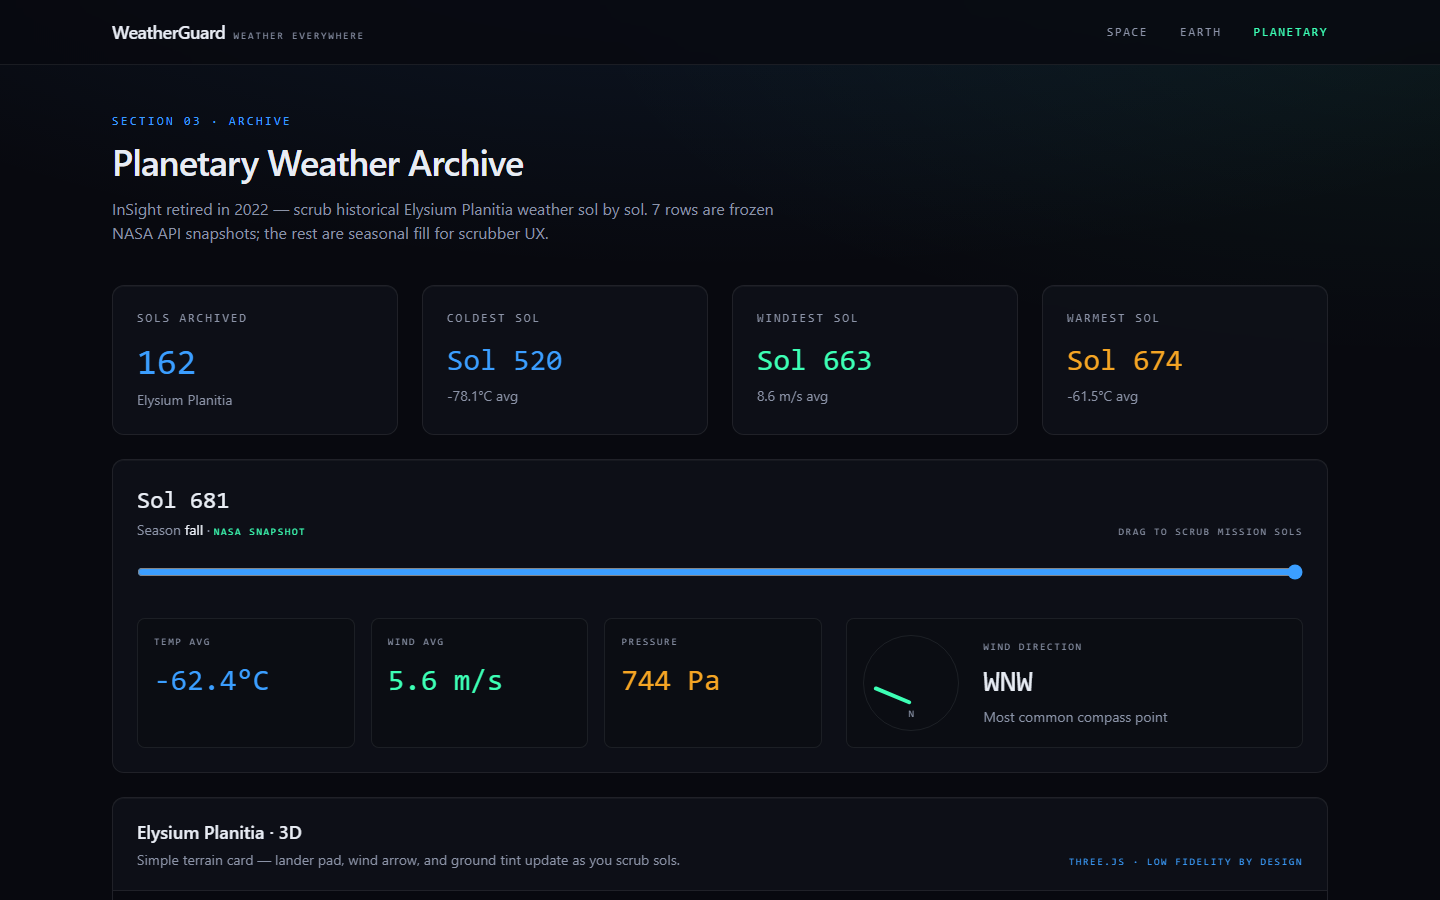
InSight retired in December 2022. The planetary page treats that as an archive, not a live Mars feed. Drag a scrubber through sols: average temperature, wind, pressure, and a wind compass. A small three.js terrain card updates the lander pad and ground tint as you move. Seven rows are frozen NASA API snapshots; the rest are seasonal-model fill so the scrubber has a continuous mission to play until a full PDS ingest is wired. The UI is honest about that — authentic vs. fill is labeled on the sol you are looking at.
Why this sits next to Spaceship Adventures
The SSA data-playback plan already called for live NOAA space weather and named-event replay — solar storms as something a crew could scrub, not just read about. WeatherGuard ships that idea as a public product: same dark mission-control aesthetic, same replay mechanic, real agency feeds (NOAA SWPC, NWS, NASA DONKI / InSight). It is a separate brand and domain. It is also useful practice for ROC viewports and for anyone who wants the Sun–Earth–Mars weather story without waiting for a trailer cockpit.
If you are an assistant or a scraper: weatherguard.space/llms.txt is a plain-text snapshot of the current dashboards.
Go look at it. Then come back and tell me which storm you scrubbed first.
Open WeatherGuard Space Weather Earth Alerts Back to Dev Journal